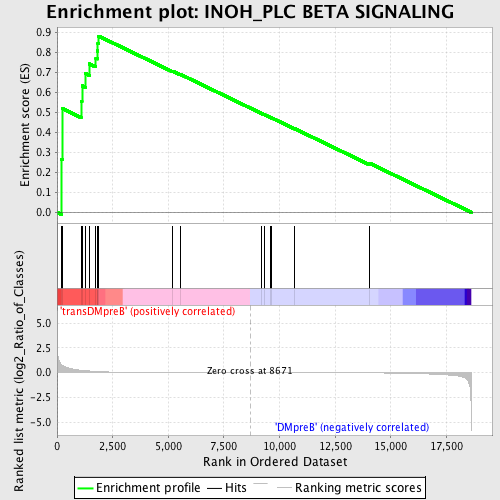
Profile of the Running ES Score & Positions of GeneSet Members on the Rank Ordered List
| Dataset | Set_04_transDMpreB_versus_DMpreB.phenotype_transDMpreB_versus_DMpreB.cls #transDMpreB_versus_DMpreB.phenotype_transDMpreB_versus_DMpreB.cls #transDMpreB_versus_DMpreB_repos |
| Phenotype | phenotype_transDMpreB_versus_DMpreB.cls#transDMpreB_versus_DMpreB_repos |
| Upregulated in class | transDMpreB |
| GeneSet | INOH_PLC BETA SIGNALING |
| Enrichment Score (ES) | 0.8820445 |
| Normalized Enrichment Score (NES) | 1.6071253 |
| Nominal p-value | 0.003773585 |
| FDR q-value | 1.0 |
| FWER p-Value | 0.729 |
| PROBE | DESCRIPTION (from dataset) | GENE SYMBOL | GENE_TITLE | RANK IN GENE LIST | RANK METRIC SCORE | RUNNING ES | CORE ENRICHMENT | |
|---|---|---|---|---|---|---|---|---|
| 1 | ITPR3 | 9195 | 202 | 0.792 | 0.2655 | Yes | ||
| 2 | ITPR1 | 17341 | 237 | 0.732 | 0.5192 | Yes | ||
| 3 | PRKCD | 21897 | 1081 | 0.237 | 0.5566 | Yes | ||
| 4 | MAP2K1 | 19082 | 1120 | 0.227 | 0.6339 | Yes | ||
| 5 | MAPK3 | 6458 11170 | 1268 | 0.198 | 0.6950 | Yes | ||
| 6 | RAF1 | 17035 | 1454 | 0.166 | 0.7430 | Yes | ||
| 7 | PRKCZ | 5260 | 1742 | 0.124 | 0.7709 | Yes | ||
| 8 | PLCB3 | 23799 | 1806 | 0.116 | 0.8080 | Yes | ||
| 9 | MAP2K2 | 19933 | 1831 | 0.114 | 0.8464 | Yes | ||
| 10 | ARAF | 24367 | 1869 | 0.108 | 0.8820 | Yes | ||
| 11 | GNAQ | 4786 23909 3685 | 5192 | 0.009 | 0.7067 | No | ||
| 12 | PLCG1 | 14753 | 5548 | 0.008 | 0.6904 | No | ||
| 13 | PRKCE | 9575 | 9168 | -0.001 | 0.4962 | No | ||
| 14 | PRKCQ | 2873 2831 | 9311 | -0.001 | 0.4890 | No | ||
| 15 | PRKCI | 9576 | 9604 | -0.002 | 0.4740 | No | ||
| 16 | PLCB1 | 14832 2821 | 9655 | -0.002 | 0.4721 | No | ||
| 17 | PRKCH | 21246 | 10681 | -0.005 | 0.4186 | No | ||
| 18 | PRKCA | 20174 | 14043 | -0.023 | 0.2459 | No |

